Server monitoring simplified.
XXXX-XXXXXXXXXXX /Email Us

Windows monitoring.
Get deep visibility into critical Windows server metrics like CPU, memory usage, disk utilization, services and processes and more. Identify and resolve performance or availability issues in no time.
Linux monitoring.
Proactively monitor your Linux and FreeBSD servers and identify performance degradation. Create custom plugins and monitor your entire stack with our open ecosystem.
Monitor Microsoft apps.
Analyze performance and monitor critical Microsoft apps like Microsoft Exchange, IIS, SQL, BizTalk, SharePoint, Office 365. Get actionable insights and stay on top of performance issues with instant alerts.
Plugins.
Monitor unlimited metrics with our out-of-the-box support for plugins. Create custom plugins using our open ecosystem and analyze performance data that matters.
Monitor Amazon Web Services.
Monitor key performance metrics of Amazon EC2, RDS and S3 buckets. Ensure optimal cloud resource usage round-the-clock.
Docker monitoring for devops and IT operations.
Track the performance and availability of Docker containers and analyze key metrics such as CPU usage, cache memory, bytes received and transmitted, network in/out and more.
Monitor VMware ESX servers and VMs.
Discover your entire virtual infrastructure and maximize VMware ESX/ESXi server uptime. Ensure your virtualization environment runs at peak performance always.
Track performance of your internal network.
Additionally, monitor resources behind the firewall like application and database servers, intranet portals, ERP systems, and payroll.
Microsoft apps supported: Microsoft Exchange, IIS, SQL, BizTalk, SharePoint, Office 365
Linux OS flavors supported: Debian, Ubuntu, CentOS, RedHat, Madriva, Fedora, Suse, Amazon Linux, Gentoo
Analyze root cause of downtime.
Accurately find the causes of your server downtime. We uses event logs, crash reports, CPU, memory and disk utilization, and processes to give you an in-depth analysis of what caused your server to go down.
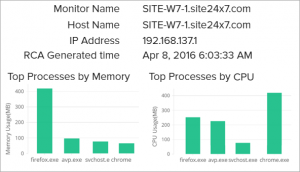

Monitor CPU, memory, and disk usage.
Track key metrics such as CPU usage broken down by processor or by core, interruptions and context switches with us. Capture critical memory usage metrics by gaining inputs on used and free memory, and memory pages (In/out/fault) to help understand your capacity. Analyze disk utilization and disk (I/O) to help you find the optimal disk capacity and ensure nonstop usage.
Get visibility into network traffic.
Keep a close eye on traffic to determine what capacity your network is running at. Visualize input and output traffic, along with their bandwidth utilization. Gain inputs on:
* Data sent/received
* Packets sent/received
* Error packets
* Speed and status of the network interface


Processes and services monitoring.
Processes and Windows services can be seen in real-time and individually monitored, so you no longer have to wonder which process caused a server spike. Start and stop Windows services from a single console and view all the information in an integrated dashboard.
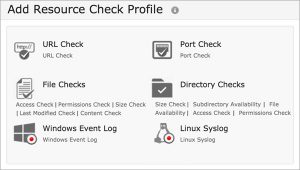
Monitor resources on your server.
Productively monitor resources available on your server using our Resource Checks. Get instant notification for any violation on URL, Port, File monitoring, Directory monitoring, Windows Event log monitoring and Linux Syslog file monitoring.
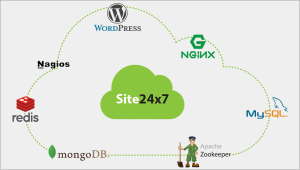
Build custom Plugins and see the data you need.
Monitor various metrics using our open ecosystem for plugins with out-of-the-box support forNagios, MySQL, Redis, Memcached, MongoDB, NGINX, HAProxy, Zookeeper, WordPress, Apache,Zombie Process. Build custom plugins easily and analyze performance data that matters. Learn more.
How it works?
- Download and install the agent in the server.
- The agent will collect critical metrics such as CPU, memory and disk usage.
- Configure thresholds and stay alerted during downtime instantaneously.
- Start / stop services from a mobile device.
Server Monitoring Pricing
STANDARD
$9 / month (paid annually)
- Monitor 10 Servers
- 50 SMS/Voice credits per month
FEATURES – Monitor your entire server stack
- Windows, Linux, FreeBSD & OS X Servers
- Windows & Linux Plugin Monitoring
- Process and Services monitoring
- Windows Event Log Monitoring
- Linux Syslog Monitoring
- File, Directory & Resource monitoring
- SLA Management and Monitor Groups
FEATURES – Monitor your entire server stack
- IIS Server, SQL Server & Exchange Server
- Sharepoint, Office 365 & BizTalk Server
- Docker Monitoring
- VMware Hosts and VMs
- Amazon Web Services, EC2Instance
- SMS & Voice Alerts
- iOS and Android app
ADD-ONS (buy multiple units)
Additional 10 Servers (Windows, Linux, FreeBSD, ESX Host, EC2 Instances, IIS, SQL, Exchange) : $10/mo
Additional 5 Windows Advanced Apps (SharePoint, Biztalk) : $60/mo
Additional 25 Windows Advanced Apps (SharePoint, Biztalk) : $200/mo
Copyright © 2016 Spectra Technologies India Pvt. Ltd. All rights reserved.